import pandas as pd
import matplotlib.pyplot as plt
import numpy as np
import seaborn as sns
%matplotlib inline

plt.style.use('ggplot')countries= pd.read_csv('../data/countries-of-the-world.csv')
countries.head()| Country | Region | Population | Area (sq. mi.) | Pop. Density (per sq. mi.) | Coastline (coast/area ratio) | Net migration | Infant mortality (per 1000 births) | GDP ($ per capita) | Literacy (%) | Phones (per 1000) | Arable (%) | Crops (%) | Other (%) | Climate | Birthrate | Deathrate | Agriculture | Industry | Service | |
|---|---|---|---|---|---|---|---|---|---|---|---|---|---|---|---|---|---|---|---|---|
| 0 | Afghanistan | ASIA (EX. NEAR EAST) | 31056997 | 647500 | 48,0 | 0,00 | 23,06 | 163,07 | 700.0 | 36,0 | 3,2 | 12,13 | 0,22 | 87,65 | 1 | 46,6 | 20,34 | 0,38 | 0,24 | 0,38 |
| 1 | Albania | EASTERN EUROPE | 3581655 | 28748 | 124,6 | 1,26 | -4,93 | 21,52 | 4500.0 | 86,5 | 71,2 | 21,09 | 4,42 | 74,49 | 3 | 15,11 | 5,22 | 0,232 | 0,188 | 0,579 |
| 2 | Algeria | NORTHERN AFRICA | 32930091 | 2381740 | 13,8 | 0,04 | -0,39 | 31 | 6000.0 | 70,0 | 78,1 | 3,22 | 0,25 | 96,53 | 1 | 17,14 | 4,61 | 0,101 | 0,6 | 0,298 |
| 3 | American Samoa | OCEANIA | 57794 | 199 | 290,4 | 58,29 | -20,71 | 9,27 | 8000.0 | 97,0 | 259,5 | 10 | 15 | 75 | 2 | 22,46 | 3,27 | NaN | NaN | NaN |
| 4 | Andorra | WESTERN EUROPE | 71201 | 468 | 152,1 | 0,00 | 6,6 | 4,05 | 19000.0 | 100,0 | 497,2 | 2,22 | 0 | 97,78 | 3 | 8,71 | 6,25 | NaN | NaN | NaN |
sns.scatterplot(x=countries['GDP ($ per capita)'], y=countries['Phones (per 1000)'])
plt.show()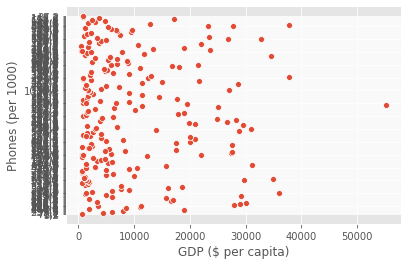
this plot does not show a linear relationship between GDP and percent literate, countries with a lower GDP do seem more likely to have a lower percent of the population that can read and write.
sns.scatterplot(x=countries['GDP ($ per capita)'], y=countries['Literacy (%)'])
plt.show()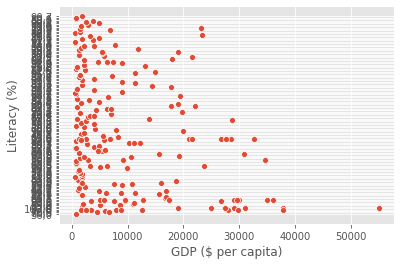
how many countries are in each region of the world?
sns.countplot(y=countries['Region'])
plt.show()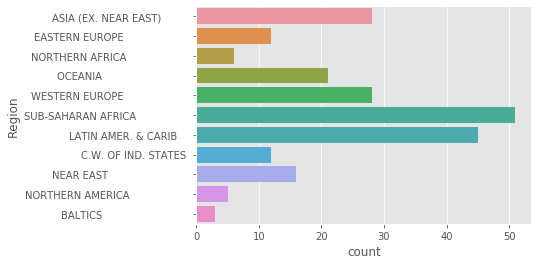
Sub-Saharan Africa contains the most countries in this list.